JAMOVI/
A THREE PHASE
USABILITY STUDY
Why a statistical workbench feels effortless to its users while quietly producing wrong conclusions, and what that means now that AI agents have started clicking the same buttons.
A Quiet Paradox
Six STEM participants, all with a college statistics course but under five hours of Jamovi exposure, played the role of sleep researchers. The dataset contained two seeded traps: an outlier of value 200, and the string "3a" hidden in a numeric column. The second trap silently flips the whole column to text and breaks every downstream analysis.
Three large language models (DeepSeek v3, Gemini 2.5 Pro, Grok 4.1) each coded the think aloud transcripts five times. Inter coder agreement ranged from 0.836 to 0.888, all above the 0.80 threshold.
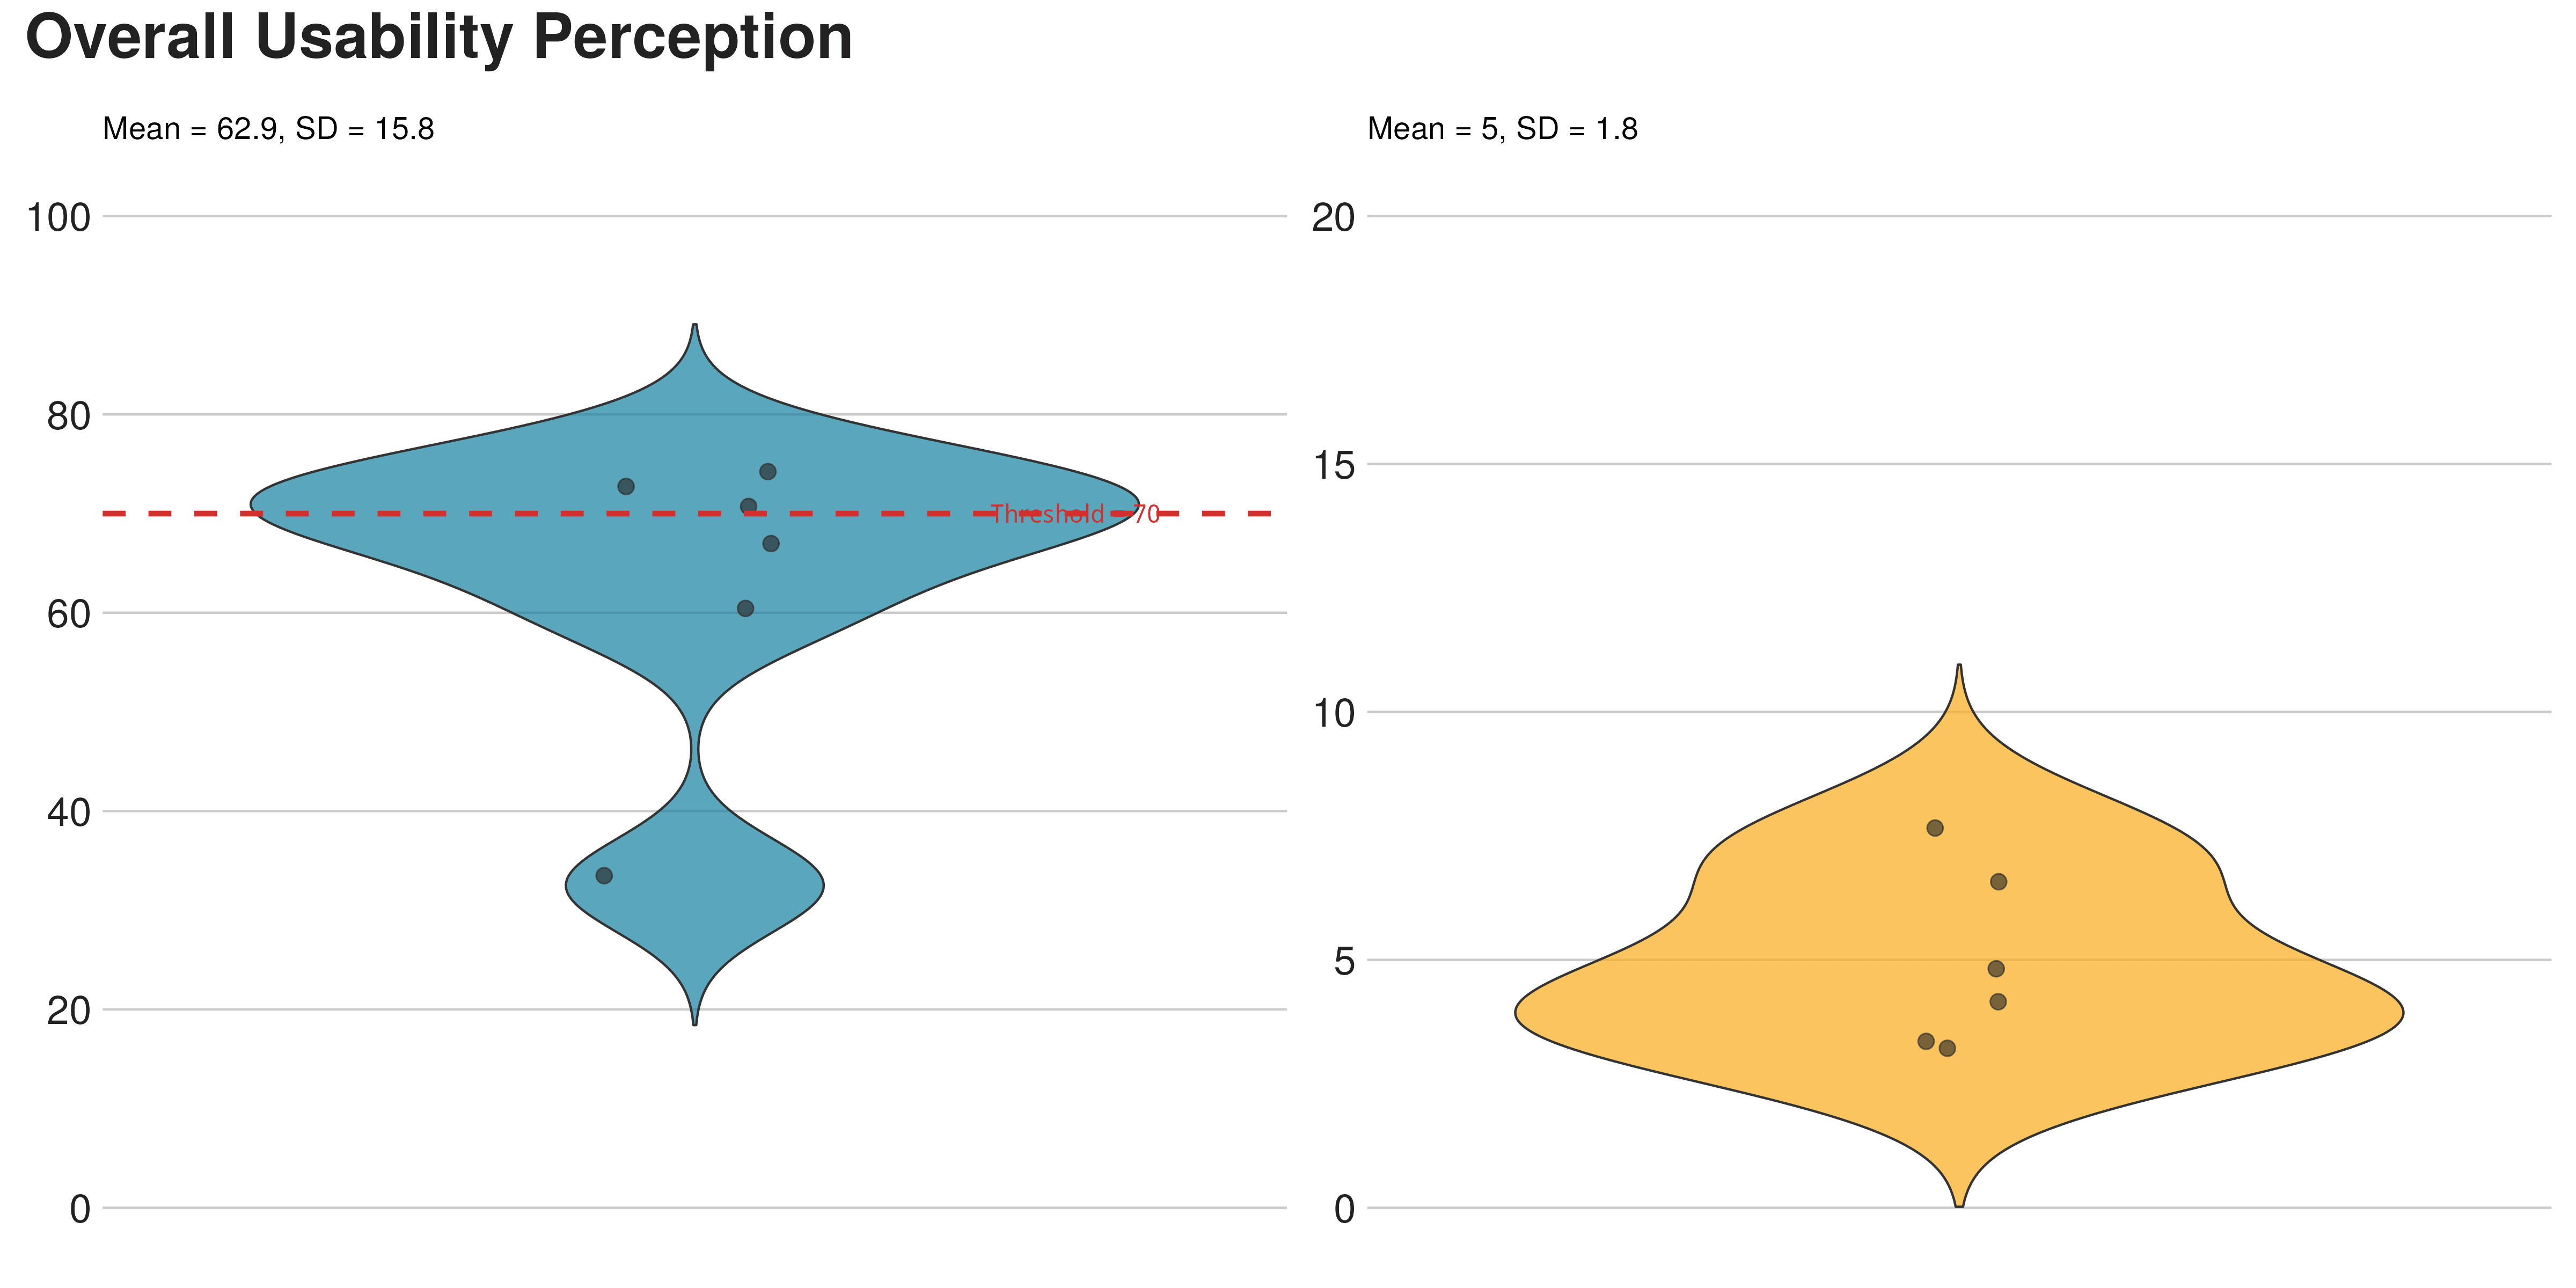
Felt easy
NASA TLX (Performance dimension omitted, score is relative).
70 errors
Six users felt nothing was wrong while breaking the analysis 70 times.
Four error clusters
K MEANS / N=70 / CODED FROM THINK ALOUD + SCREEN RECORD
Missing
error feedback
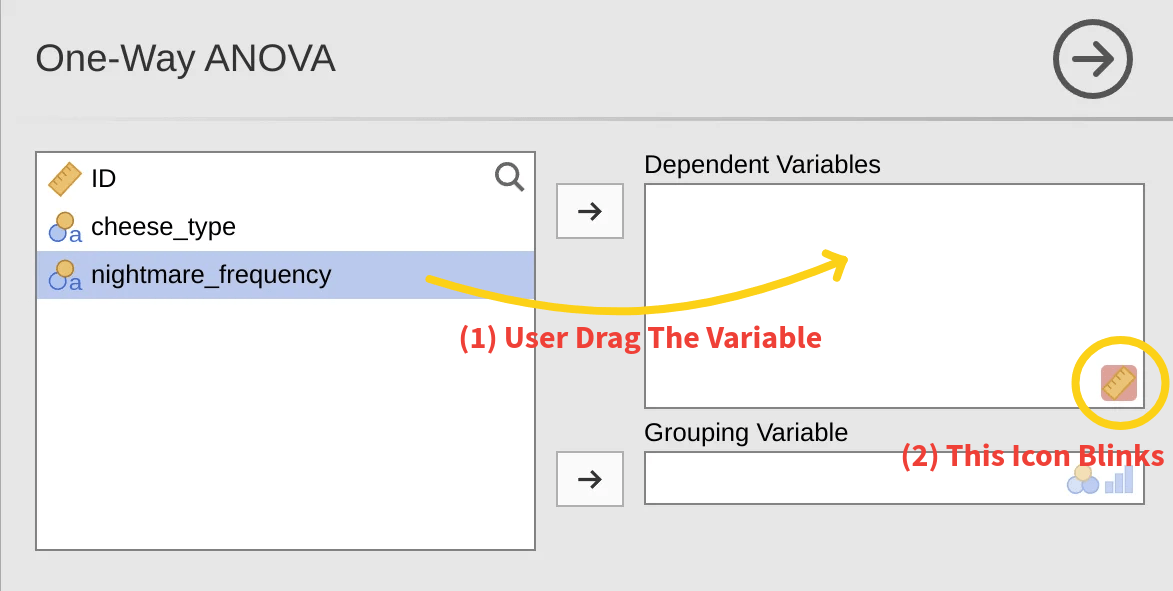
A drag onto the wrong slot triggers a brief icon flicker. All six users saw it. None decoded it.
High risk
workarounds
Blocked from the right variable, users dragged the only one that fit: the row ID. Jamovi ran the test without warning.
Mental model
collisions
Excel and SPSS habits leaked in. One user tried to paste analysis output into the data grid to "compare side by side".
Skipped
data prep
A scan, a delete, a confident "no problem". Only one of six caught the "3a" string trap.
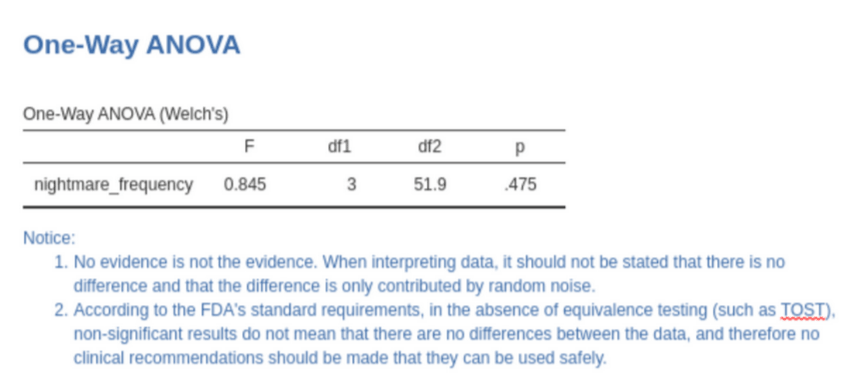
Of users who saw "p > 0.05" wrote it down as "cheese has no effect on nightmares". Literature on 791 papers reports the same conflation in roughly 51% of cases. The tool inherits the field's bad habit and amplifies it.
Tracing The Bottleneck
Three UX students with statistics literacy but no Jamovi history performed a PURE cognitive walkthrough plus a Nielsen heuristic evaluation. Two methods in tension: one locates where the user will stall, the other diagnoses why.
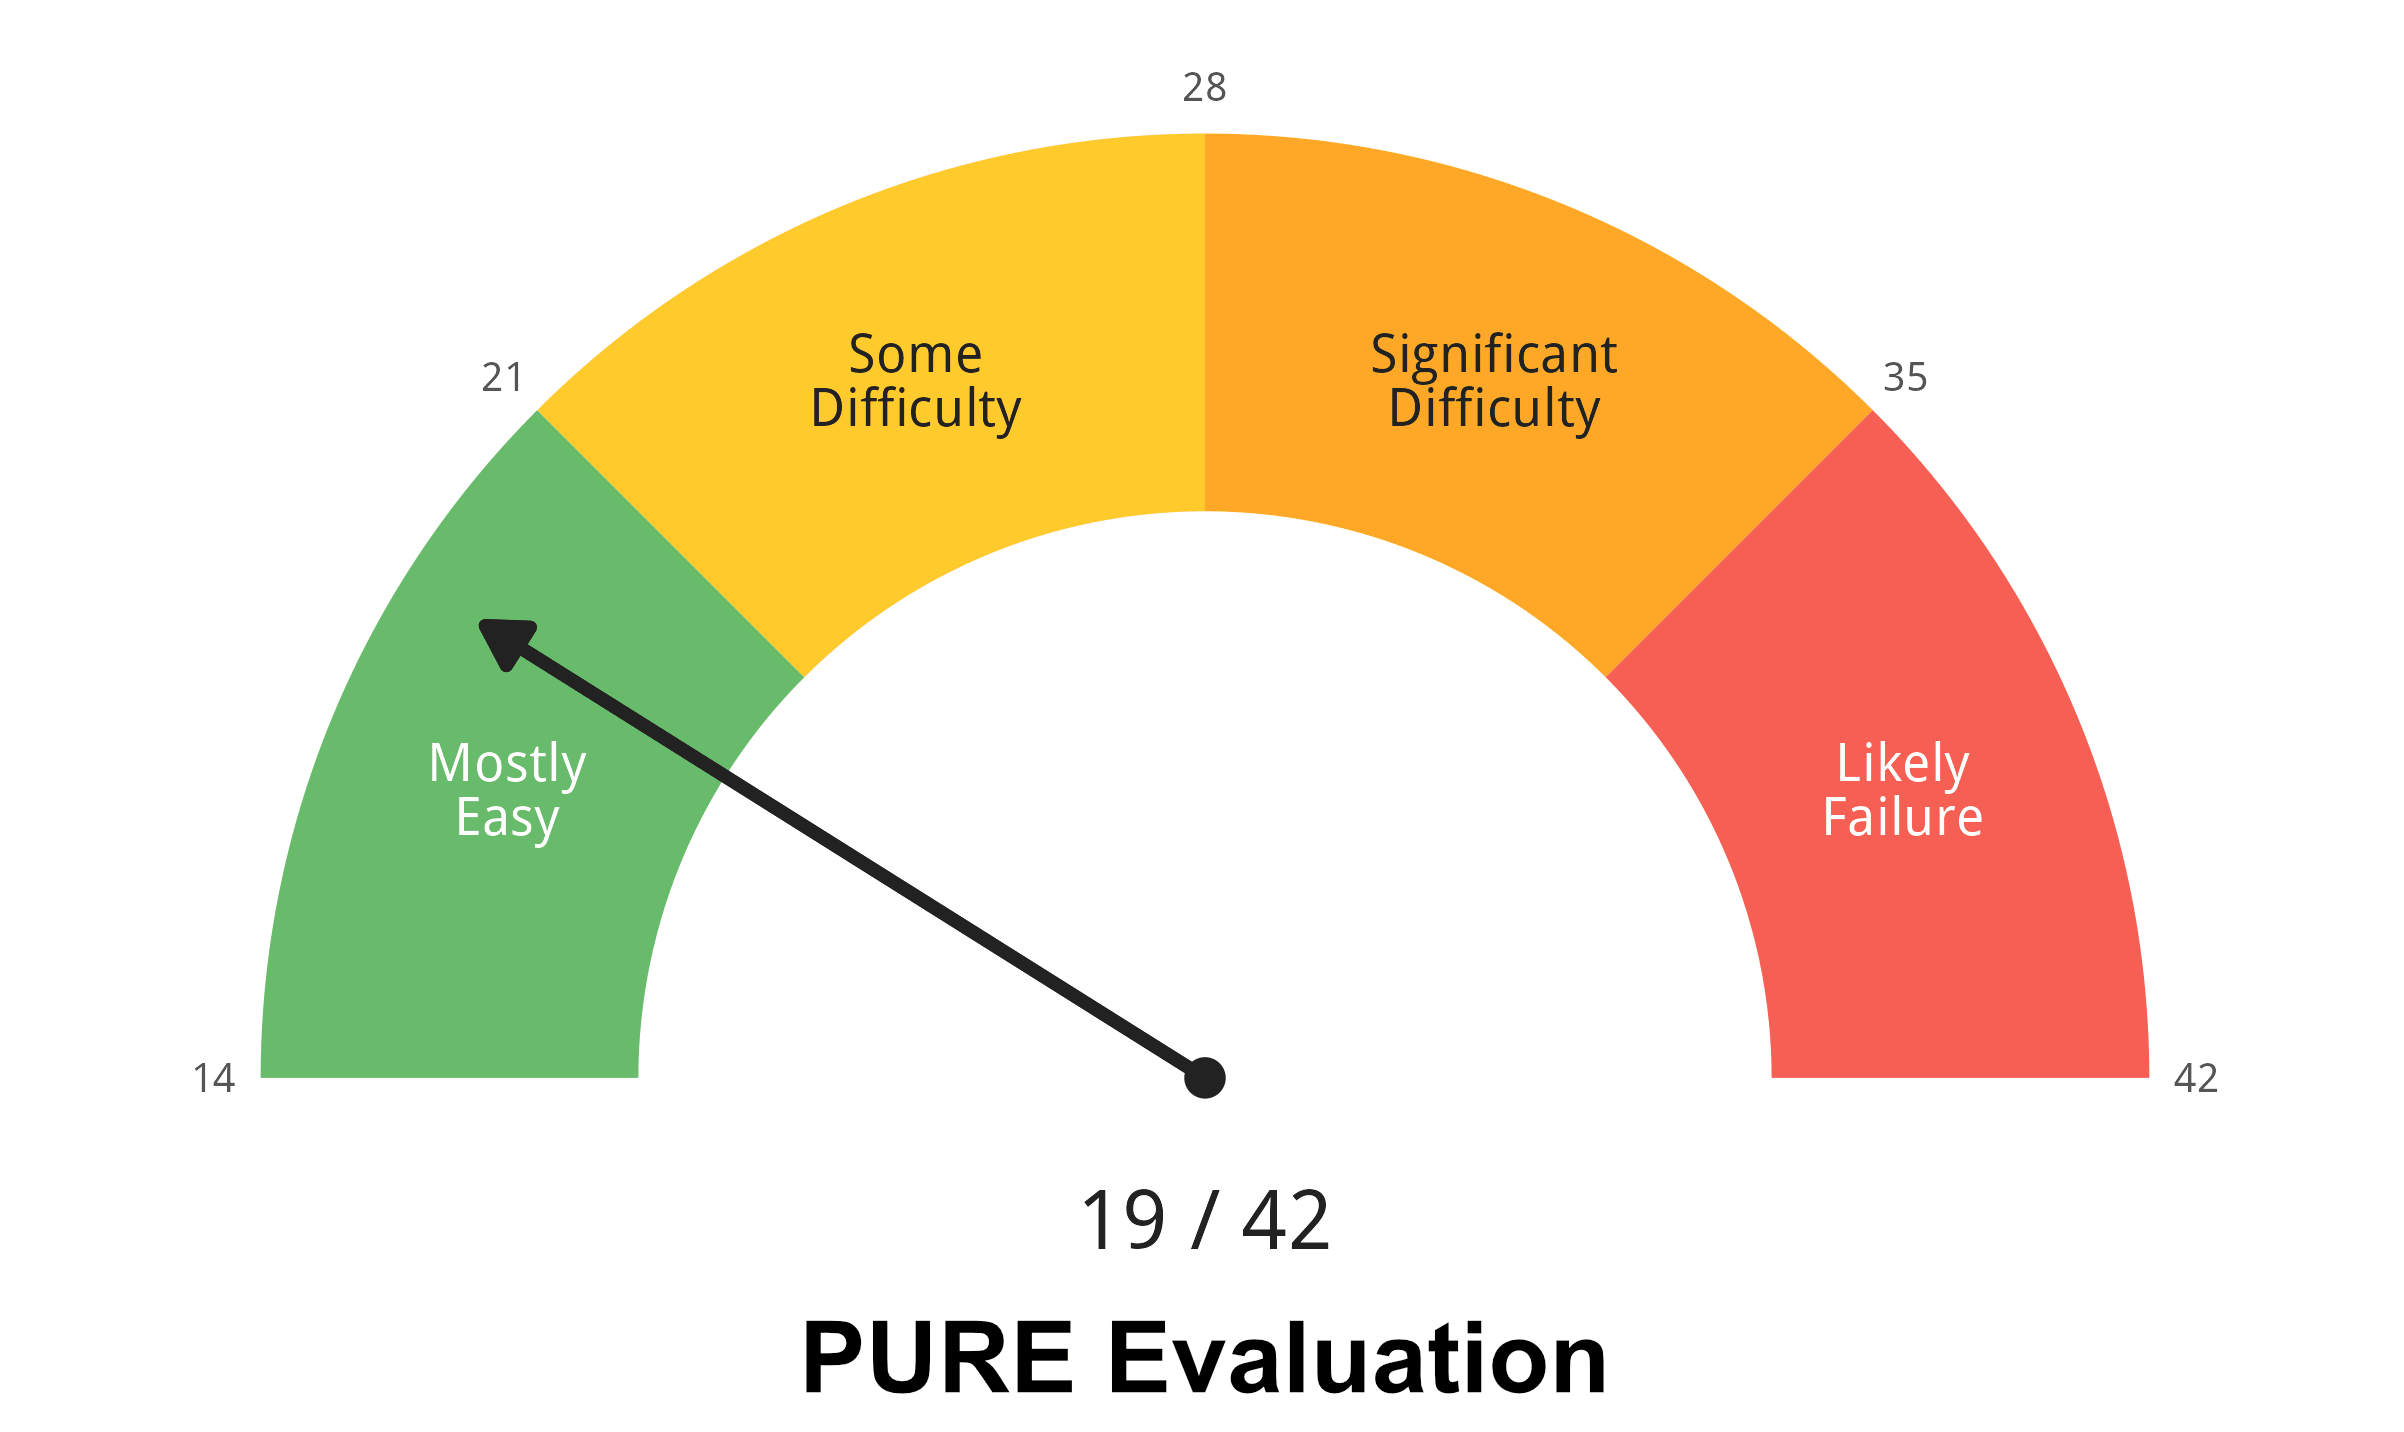
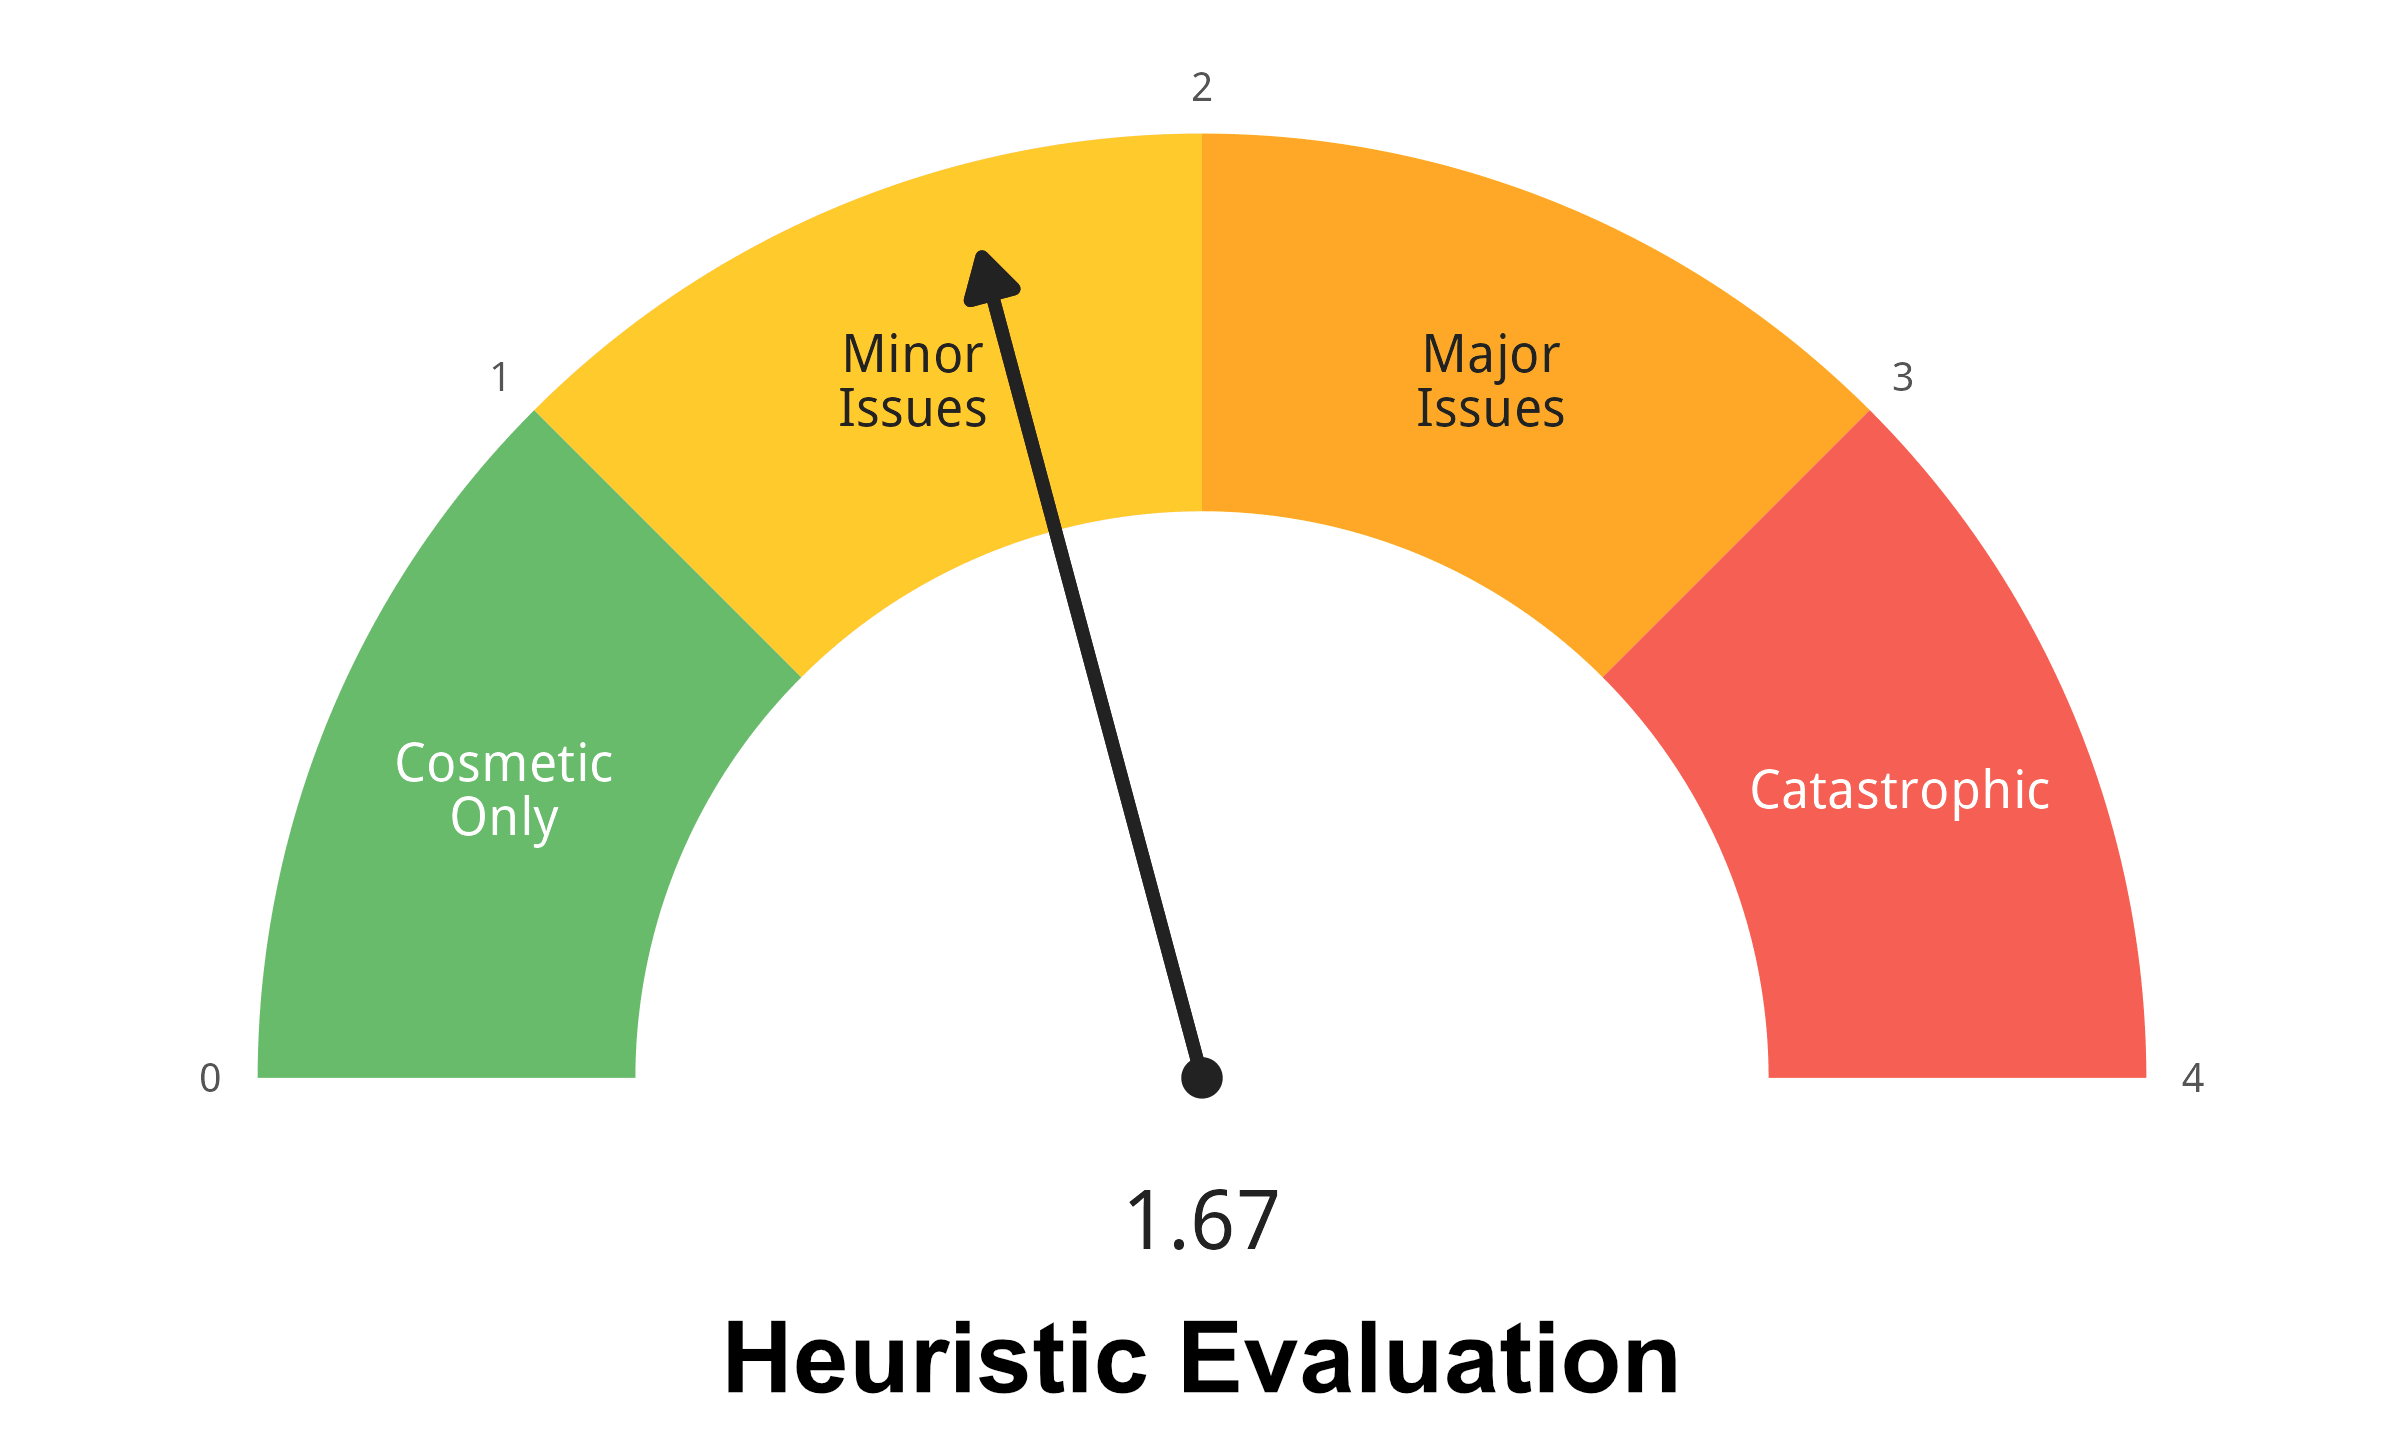
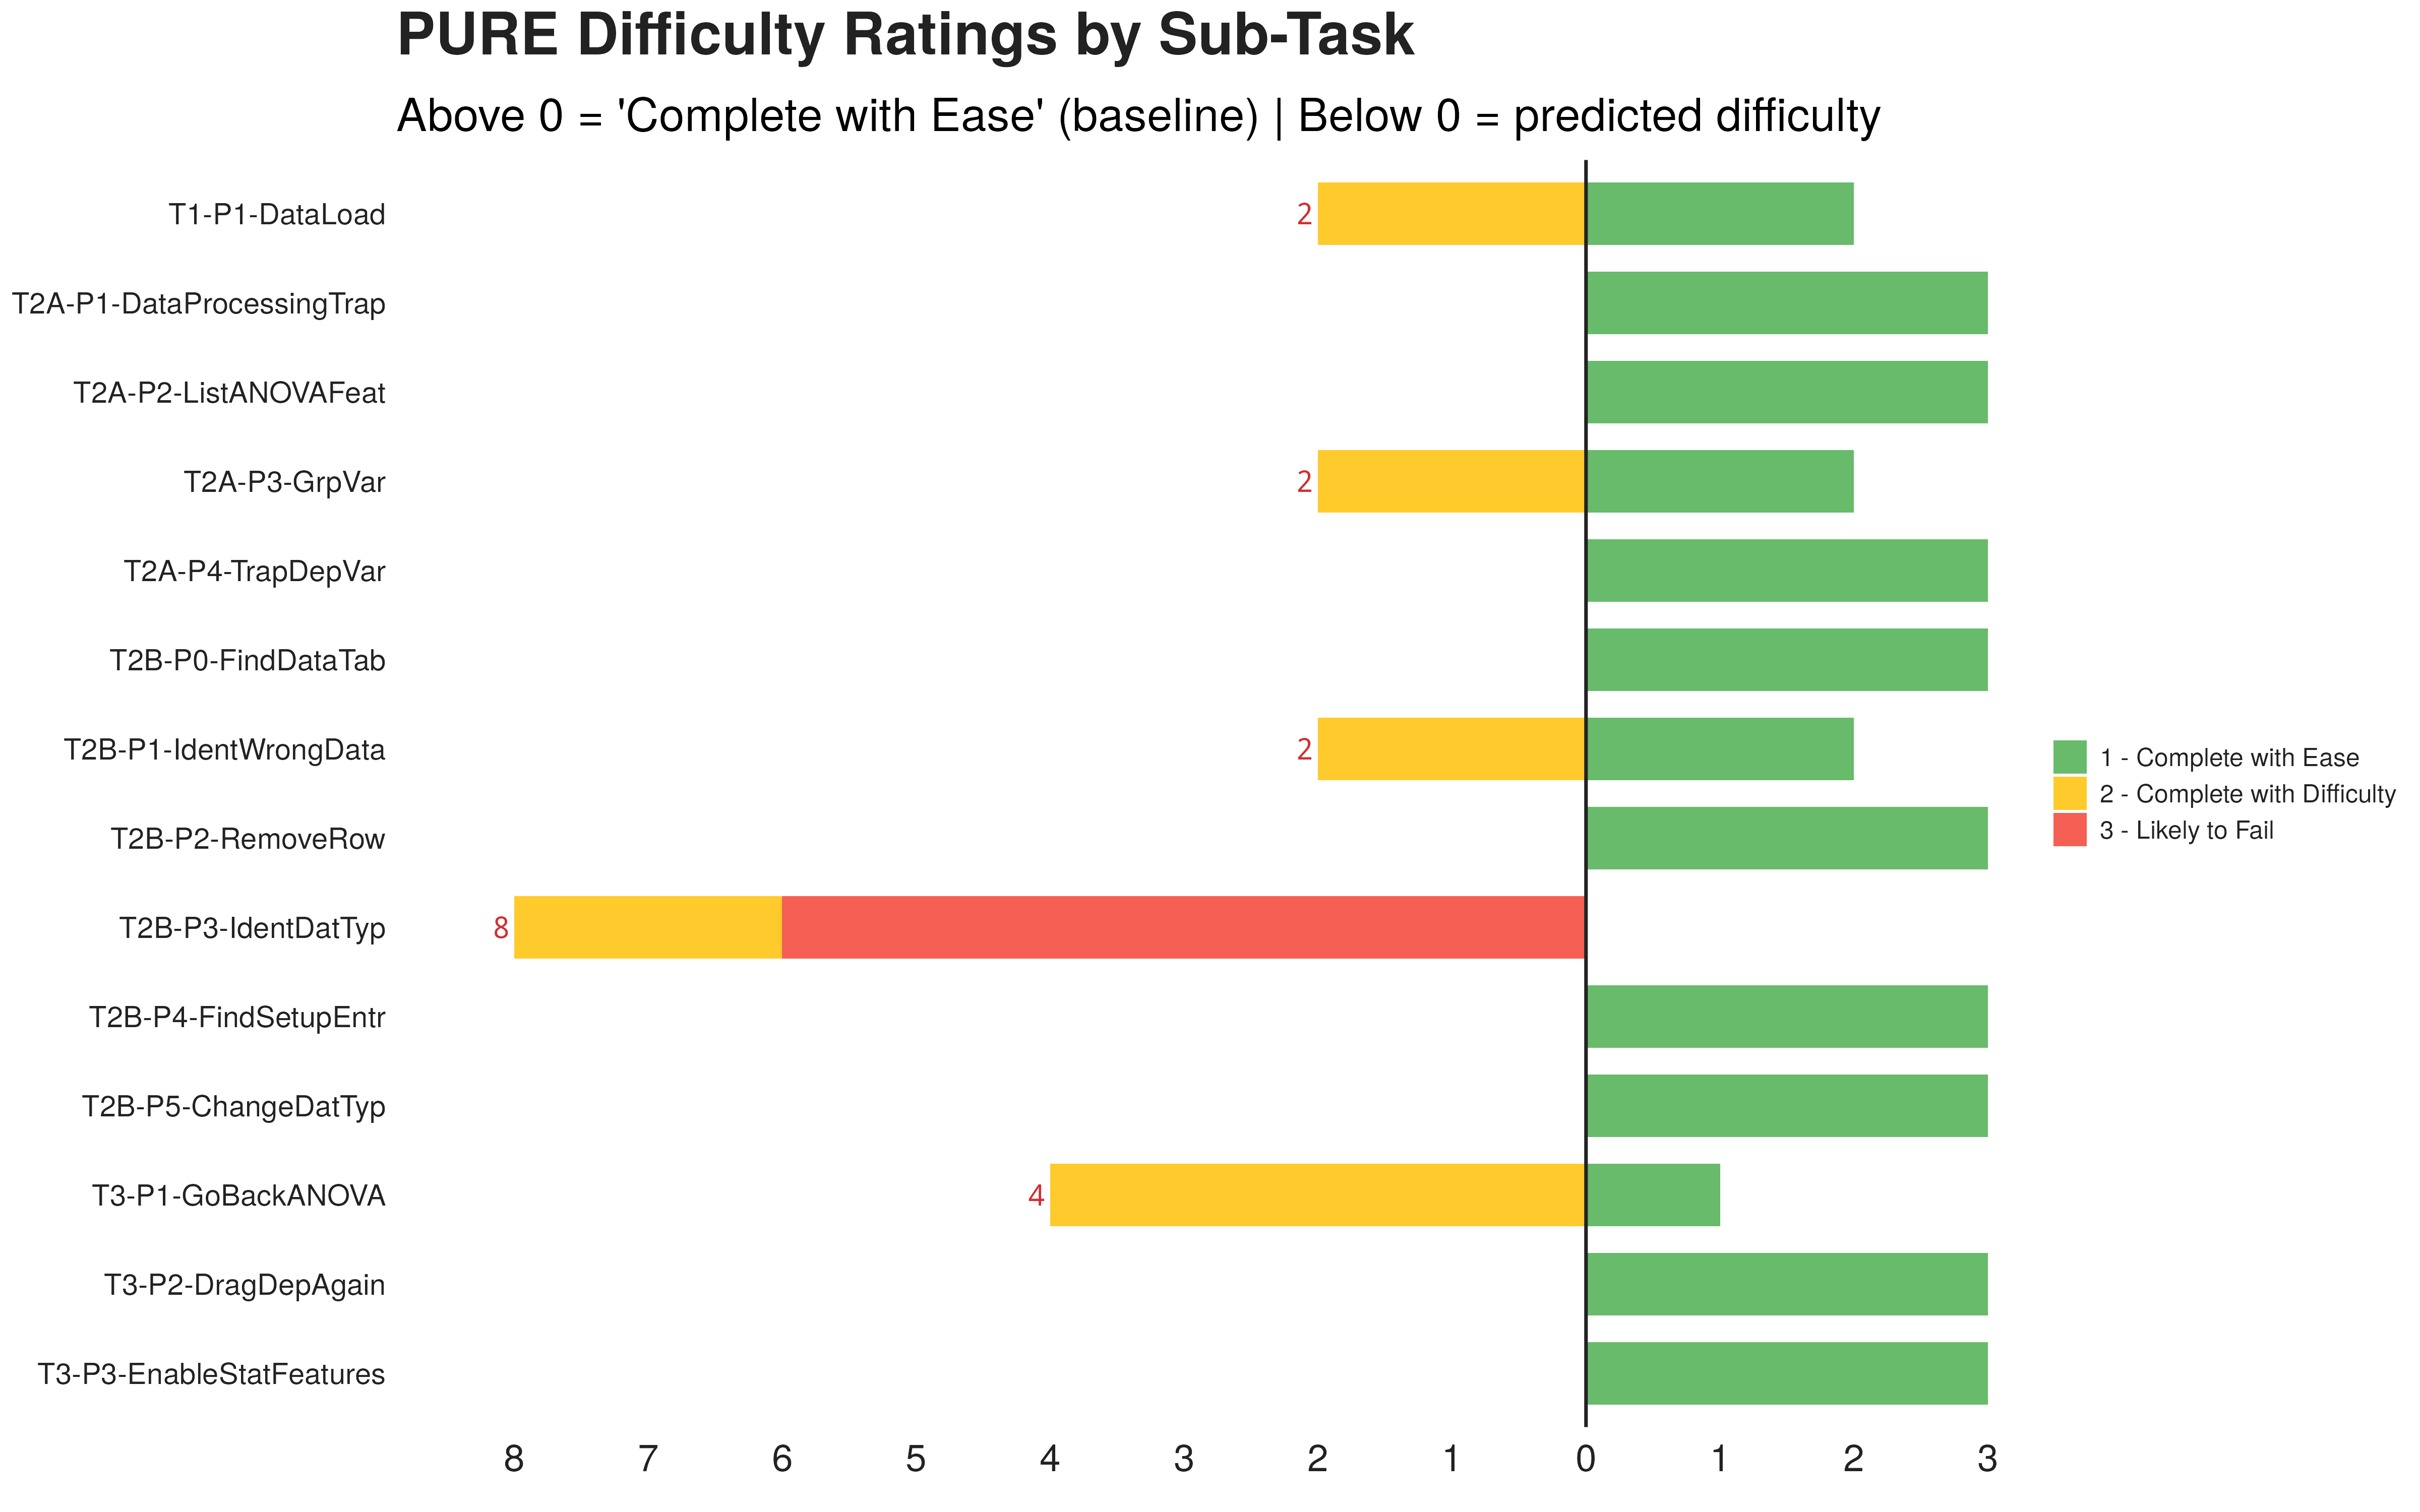
Both gauges read green. The interesting story is in their distribution. Two heuristics dominate the violations: Help & Documentation (9 / 12) and Error Recovery (8 / 12). One PURE step stands alone with a 3: "Identify wrong data type". It is the only step that is purely cognitive. No click is required. Nothing on screen says it is happening.
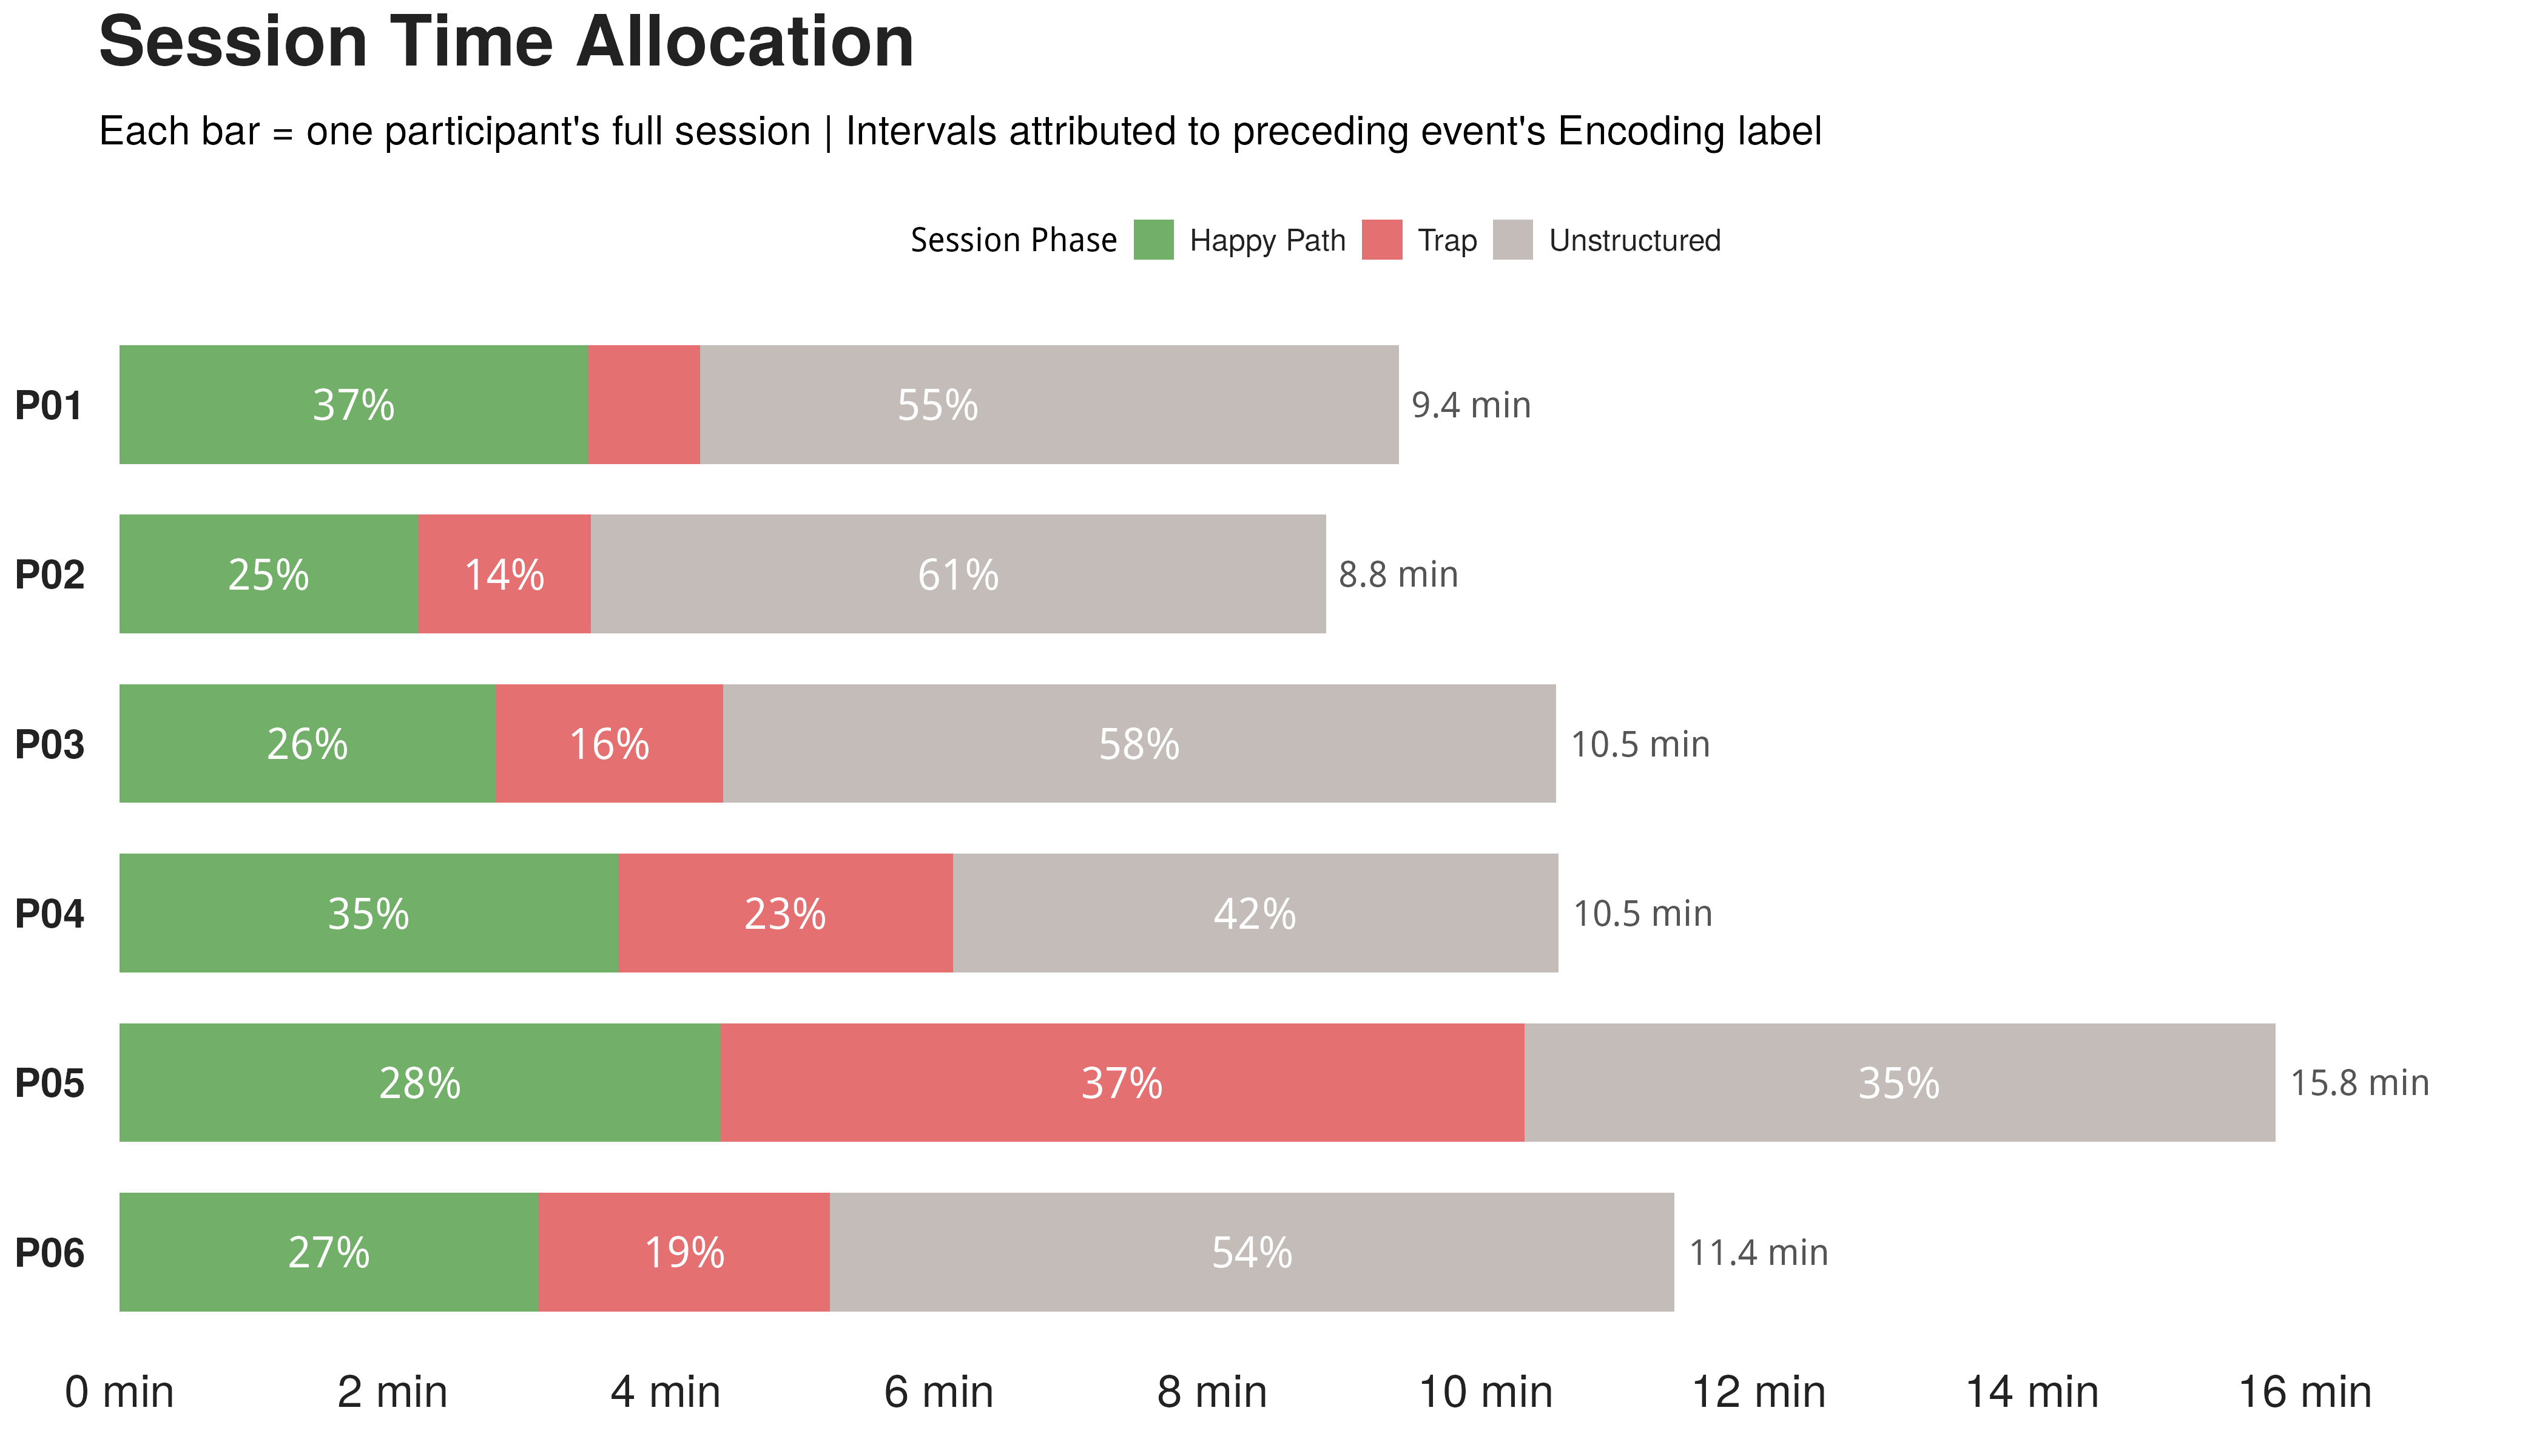
The invisible step explodes downstream
Mapping the 70 phase 1 errors back onto the 14 PURE steps produces a counter intuitive distribution. The hardest cognitive step receives almost no error events. The easiest looking step absorbs 29 of them.
A pure inference step. Only icon based. Two of six users never solved it independently.
Five drag attempts, "the ruler is blinking", six minutes lost.
Four analysis tools tried in five minutes. Eventually surrendered.
Drags row ID as the dependent. Reads off a meaningless F statistic. Reports a confident, wrong conclusion.
Reached the correct data type recognition without prompting.
When The User Is A Model
The same task was handed to seven AI agents using a NixOS based Computer Use rig. Operation layer first, then the interpretation layer.
Interpretation flips with two lines
Task completion is a model bottleneck today. Statistical interpretation is not. Ten models read the ANOVA result page five times each. Adding two sentences of advice into the result region changed almost everything.
Most models repeat the human mistake: "p > 0.05 means no difference".
Sentences embedded next to the table: "absence of evidence is not evidence of absence" and "do not issue clinical recommendations without an equivalence test". No layout tricks. Pure semantic context.
Six Moves Worth Making
Persistent error message
not a flickering icon
Replace the sub second icon blink with a visible text message stating what failed, why, and how to fix it. Screenshot based agents cannot perceive animation, the flicker is invisible to them.
Embed statistical guidance
inside test output
Print a standardised note next to ANOVA results. Two sentences pushed agent accuracy to near 100% and quietly help human readers as well.
Active data quality checks
and conversion previews
Surface columns where 95% are numeric but a few are not. Show a preview before any silent type conversion. Use a non blocking notice when entering analysis with unresolved quality issues.
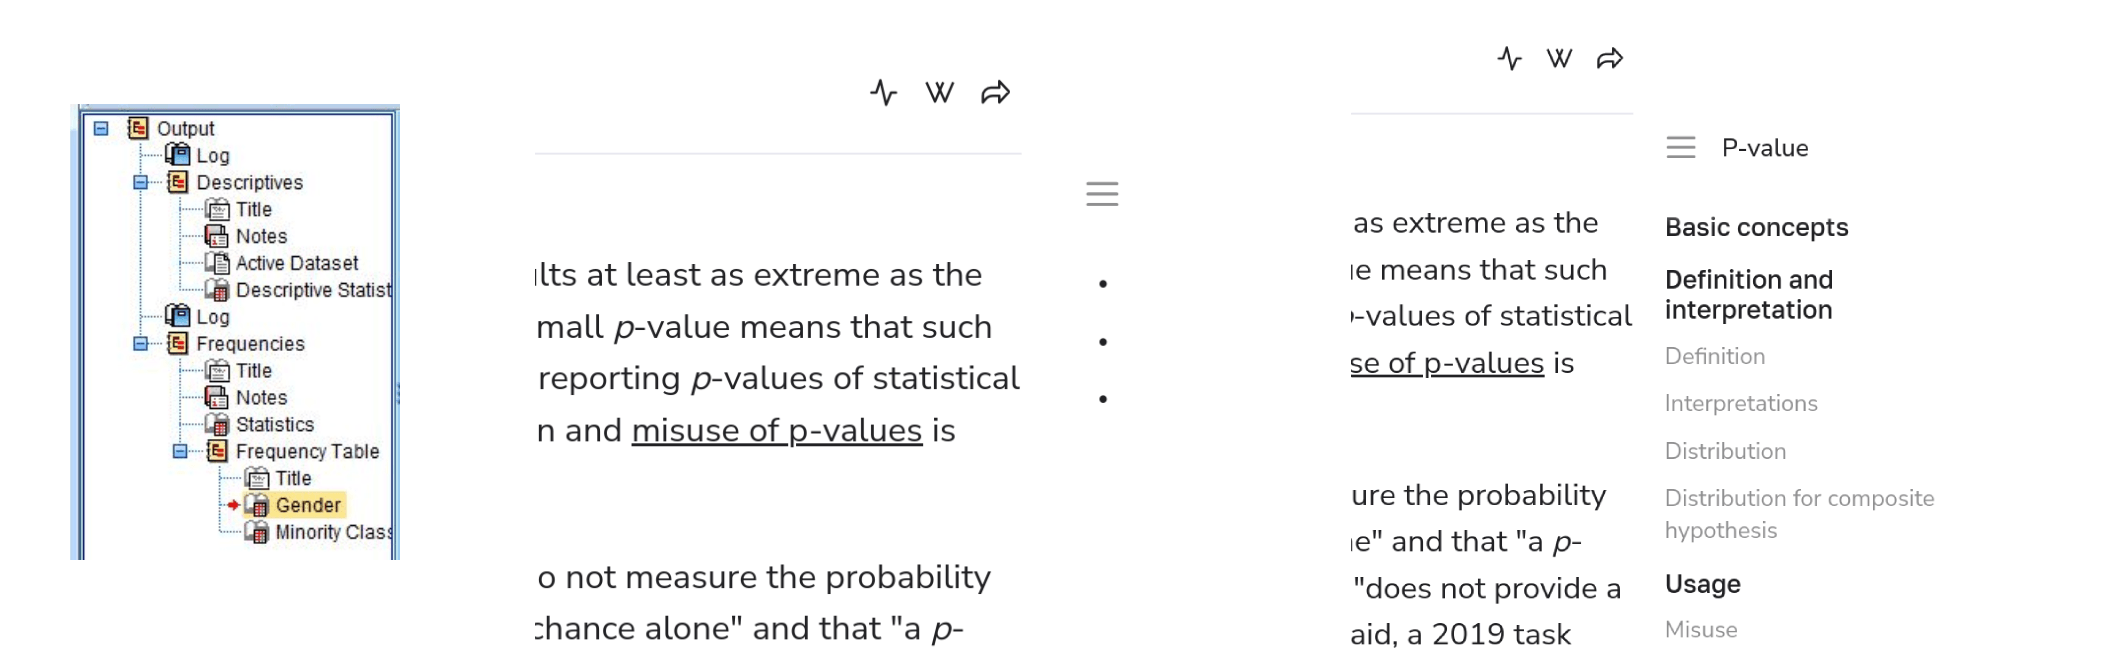
A navigable result panel,
not an empty half screen
Layer a lightweight outline navigator over the free form notebook. SPSS Output Viewer and Wikiwand floating outlines are good prior art. Recovers space, prevents accidental delete of the entire output.
One search bar for help,
features, and documentation
Bring the Office "Tell me what you want to do" pattern to the ribbon. Jamovi already borrows the ribbon. The search entry is the natural extension. No more help vacuum at the moment of need.
APA aligned default output
for hypothesis tests
Descriptives, effect sizes and a box plot should be on by default. Each unchecked box is one missed report for a human and one extra coordinate hit for an agent. Suggest post hoc comparisons when results are significant.